Definition: The least squares regression is a statistical method for managerial accountants to estimate production costs. The least squares regression uses a complicated equation to graph fixed and variable costs along with the regression line of cost behavior.
What Does Least Squares Regression Mean?
The regression line show managers and accountants the company’s most cost effective production levels. In other words, the least squares regression shows management how much a product they should produce based on how much it costs the company to manufacture. Financial calculators and spreadsheets can easily be set up to calculate and graph the least squares regression.

Example
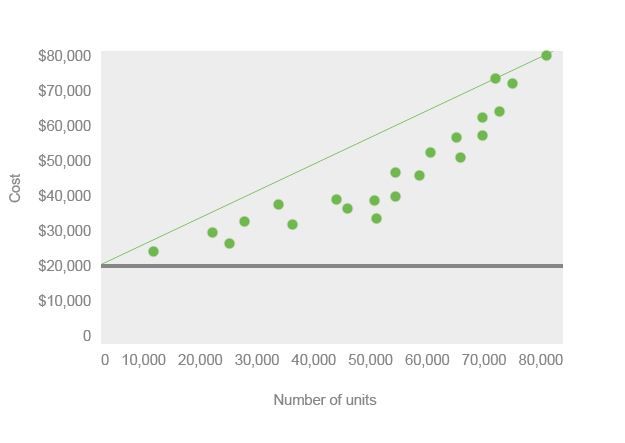
The least squares regression equation is y = a + bx. The A in the equation refers the y intercept and is used to represent the overall fixed costs of production. In the example graph below, the fixed costs are $20,000. B in the equation refers to the slope of the least squares regression cost behavior line. X refers to the input variable or estimated number of units management wants to produce.
When the equation is solved, y equals the total cost of the estimated number of units at the current fixed and variable costs. A regression line is often drawn on the scattered plots to show the best production output. Here is an example of the least squares regression graph.

Managerial accountants use other popular methods of calculating production costs like the high-low method. The high-low method is much simpler to calculate than the least squares regression, but it is also much more inaccurate.


