
Definition: The Lorenz Curve is a graphical illustration of a statistical distribution used to measure wealth distribution equality. In different words, it is a graphic display that shows how wealth is distributed among the population.
What Does the Lorenz Curve Mean?
This model was developed by Max Lorenz in the beginning of the 20th century. The purpose of the curve is to show the degree of social equality of a country by displaying how much wealth a given percentage of the population possesses. The X axis measures the cumulative % of the population and the Y axis measures the cumulative percentage of income or wealth for each percentage. Perfect distribution is represented by a straight diagonal line between both axis that starts at the (0;0) point and ends at the (1;1) or the (100;100) point depending on the scale.
Then the curve is draw by using the data of income or wealth distribution. The X axis should be arranged to have an ascendant order from lowest to highest income or wealth proportion. This means that cumulative percentages of population should be arranged starting at the less wealthy bracket of people to the wealthiest bracket.
Here’s an example of how this curve will be constructed.
Example
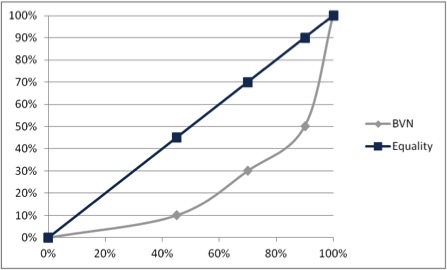 Country BVN is currently in the process of measuring income equality among its population. The financial entities of the government decided to use the Lorenz Curve to analyze this. There was a general census to collect the required data to construct the model. The results were the following: the first 45% of the population earned 10% of the income; the next 25% earned 20% of the income; the next 20% earned 20% of the income and the next 10% earned 50%. How would a Lorenz Curve look like?
Here’s how a Lorenz Curve will look like for BVN. By using the data provided by the Government we can develop this graphic to show the country’s current wealth distribution.

