What is the Chart of Accounts? – Definition
Contents
The chart of accounts is a list of every account in the general ledger of an accounting system. Unlike a trial balance that only lists accounts that are active or have balances at the end of the period, the chart lists all of the accounts in the system. It’s a simple list of account numbers and names. It doesn’t include any other information about each account like balances, debits, and credits like a trial balance does.
You can think of this like a rolodex of accounts that the bookkeeper and the accounting software can use to record transactions, make reports, and prepare financial statements throughout the year.
Chart of Accounts Format and Number System
Each account is typically assigned a number based on the order it appears on the financial statements. Balance sheet accounts are usually presented first followed by income statement accounts. Thus, accounts are assigned numbers and listed in this order: assets, liabilities, equity, income, expenses, other.
Most companies use a numbering system that groups accounts into financial statement categories. For example, all asset accounts might have a prefix of 1 while liability accounts might have a prefix of 2. This numbering system looks like this:
- Assets: 1-001
- Liabilities: 2-001
- Equity: 3-001
- Revenues: 4-001
- Expenses: 5-001
- Other: 6-001
This numbering system helps bookkeepers and accountants keep track of accounts along with what category they belong two. For instance, if an account’s name or description is ambiguous, the bookkeeper can simply look at the prefix to know exactly what it is. Take insurance for example. An account might simply be named “insurance offset.” What does that mean? Is it a prepaid asset or an expense that was paid out? The bookkeeper would be able to tell the difference by the account number. An asset would have the prefix of 1 and an expense would have a prefix of 5. This structure can avoid confusion in the bookkeeper process and ensure the proper account is selected when recording transactions.
Although most accounting software packages like Quickbooks come with a standard or default list of accounts, bookkeepers can set up and customize their account structure to fit their business and industry.
For example, many companies have different departments that incur similar costs like supplies. Management might want to evaluate the supplies expenses for each department to see which one is using its resources the most efficiently. To make this comparison easier, the bookkeeper could tag the expenses to different departments of simply use different numbered accounts for each department. Department 1 could use 5-001-1 for its supplies expense while department 2 could use 5-0001-2 to differentiate it from the other departments.
Example and Template
How to Use the Chart of Accounts
There are many different ways to structure a chart of accounts, but the important thing to remember is that simplicity is key. The more accounts are added to the chart and the more complex the numbering system is, the more difficult it will be to keep track of them and actually use the accounting system. Simple is always better than complicated.
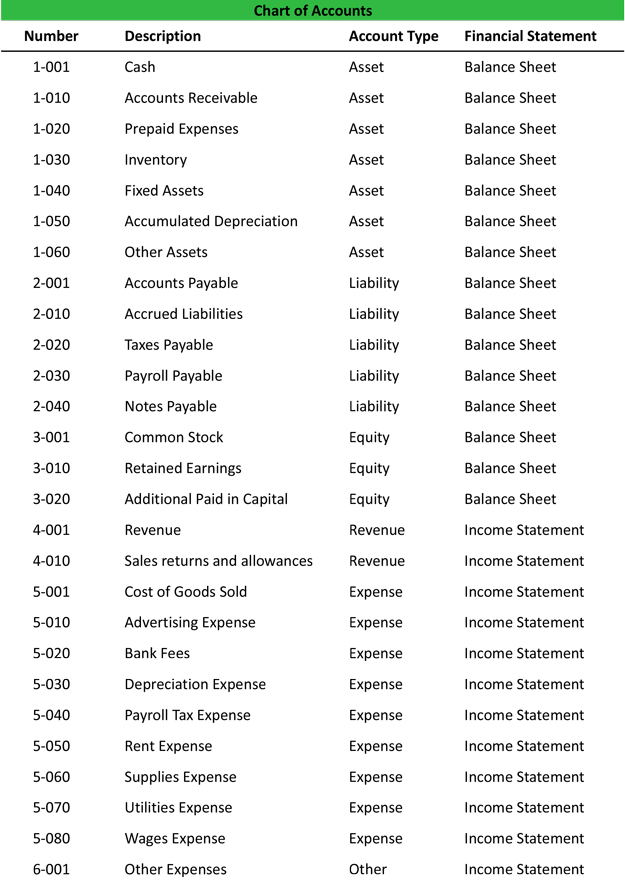
Here’s a standard example chart of accounts.

As you can see, each account is listed numerically in financial statement order with the number in the first column and the name or description in the second column.
How to Create a Chart of Accounts
There are a few things that you should keep in mind when you are building a chart of accounts for your business.
Numbering – Don’t use all concurrent numbers for your accounts. You will probably need to add accounts in the future. If you don’t leave gaps in between each number, you won’t be able to add new accounts in the right order. For example, assume your cash account is 1-001 and your accounts receivable account is 1-002, now you want to add a petty cash account. Well, this should be listed between the cash and accounts receivable in the chart, but there isn’t a number in between them. Look at the number pattern in our example above.
Size – Set up your chart to have enough accounts to record transactions properly, but don’t go over board. The more accounts you have, the more difficult it will be consolidate them into financial statements and reports. Also, it’s important to periodically look through the chart and consolidate duplicate accounts.
Changes – It’s inevitable that you will need to add accounts to your chart in the future, but don’t drastically change the numbering structure and total number of accounts in the future. A big change will make it difficult to compare accounting record between these years.


