R-squared, also known as the coefficient of determination, is the statistical measurement of the correlation between an investment’s performance and a specific benchmark index. In other words, it shows what degree a stock or portfolio’s performance can be attributed to a benchmark index.
Definition – What is R-Squared?
Contents
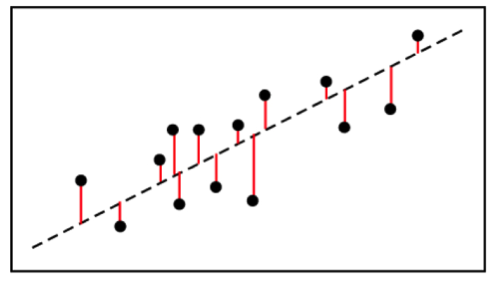
Specifically, this linear regression is used to determine how well a line fits’ to a data set of observations, especially when comparing models. Also, it is the fraction of the total variation in y that is captured by a model. Or, how well does a line follow the variations within a set of data.

Formula
The R-squared formula is calculated by dividing the sum of the first errors by the sum of the second errors and subtracting the derivation from 1. Here’s what the r-squared equation looks like.

R-squared = 1 – (First Sum of Errors / Second Sum of Errors)
Keep in mind that this is the very last step in calculating the r-squared for a set of data point. There are several steps that you need to calculate before you can get to this point.
First, you use the line of best fit equation to predict y values on the chart based on the corresponding x values. Once the line of best fit is in place, analysts can create an error squared equation to keep the errors within a relevant range. Once you have a list of errors, you can add them up and run them through the R-squared formula. Let’s take a look at an example.
Example
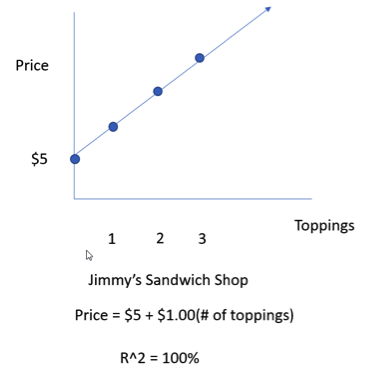
To help explain what exactly R-squared means, I’m going to tell you about two sandwich shops in my town, Jimmy’s Sandwich Shop and Fozzie’s Sandwich Emporium. At Jimmy John’s they charge $5 for a sandwich and $1.00 for each additional topping (i.e. double the meat $1.00, double the cheese $1.00, or double the lettuce for $1.00). At Fozzie’s they also charge $5.00 for a sandwich, but different topping prices (i.e. double meat $1.50, double cheese $0.75, or double lettuce $0.50).
Now, I sat outside Jimmy’s for 7 days and took a survey from all the customers leaving and asked how many toppings they ordered and what was the total price. The first customer, Joe, ordered 3 toppings and the price was $8.00. The second customer, Suzie, ordered 4 toppings and the price was $9.00. The third customer, Pat, ordered 5 topics and the price was $10.00. I ended up collecting 100 samples. At the end of the week, I plotted these points on a chart and found out that I could explain the price using the following equation Price = $5 + $1.00(# of toppings) and figured out that r-squared = 100%.

To understand what r-square tells us you must understand the word variability. When I say variability, you should think of the word “differs.” Now, I’m going to explain to you what r-squared means. We know that prices of sandwiches vary, or they differ based on the number of toppings. What R2 tells us for Jimmy’s Sandwich shop is that 100% of the differences in price can be explained by the number toppings. Or in other words, the sole reason that prices differ at Jimmy’s, can be explained by the number of toppings. Again, 100% of the variability in sandwich price is explained by the variability of toppings. Prices differ because toppings differ.
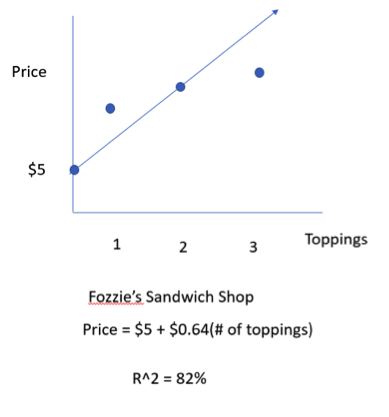
The next day I did the same thing and sat outside Fozzie’s for 7 days and collected another 100 customer’s orders. And at the end of the week I went back home, plotted the points on a chart and found that I could explain the price using the following equation. Price = $5 + $0.64(# of toppings) and R2 = 82%.

At Fozzie’s, it’s a different story. While the model does explain 82% of how the price differed, it doesn’t explain all the price differences. There are other reasons besides the number of toppings why two sandwiches might cost differently. Again, 82% of the prices differences can be explained by the differences in the number of prices. The other 28% are in the residuals. They are unexplained. The model doesn’t explain that part. Again, what R2 tells you is that the percent in the variability in Y that is explained by the model.
One of the areas where R2 is being used by analysts is in the area of factor risk models. Specifically, they are designing models to manage risks associated with their portfolios with an emphasis on minimizing risks. These models benefit from continual increases in computational power, as well as, recent developments that provide additional data points like the recent flash crashes and ’08 credit crisis.
Analysis and Interpretation
Like I said before, r-squared is a measure of how well a particular line first a set of observations.
What is R-Squared Used For?
Investors use the r-squared measurement to compare a portfolio’s performance with the broader market and predict trends that might occur in the future. For instance, let’s assume that an investor wants to purchase an investment fund that is strongly correlated with the S&P 500. The investor would look for a fund that has an r-squared value close to 1. The closer the value gets to 1, the more correlated it is.
Let’s assume the investor can choose between three funds with R2 values of .5, .7, and .9. The investor should pick the .9 fund because its performance is most correlated to the S&P 500.

Usage Explanations and Cautions
Who uses R-squared?
Some of areas within the Financial industry where r-squared is used includes:
Mutual fund performance – R-squared is used within the mutual fund industry by investors as a historical measure that represents how a funds movements correlates with a benchmark index. Also, typically stated in a fund’s prospectus). This number is first calculated by plotting the monthly returns for mutual funds vs their index benchmark (i.e. S&P 500).
For example, you might see that a fund’s r-squared is .75 or 75%. In other words, a high r-squared relative to the S&P 500, means that its’ going to be highlight correlated (or moves within tandem). Using it in an example, you might see how one fund is doing relative to a benchmark (i.e. this month the S&P went down -5% and the fund wend down -4%).
Hedge Funds – use r-squared to determine how well their Risk models, including help identify how much risk are associated with factors.
Stocks – Within the financial industry to help determine how well as stocks movement is correlated to the market, one would need to look at the “r-squared” of the regression, also known as the coefficient of determination. An R-squared close to one suggests that much of the stocks movement can be explained by the markets movement; an r squared lose to zero suggests that the stock moves independently of the broader market. For stocks and bonds the ratios is typically lower.


