The net profit margin ratio, also called net margin, is a profitability metric that measures what percentage of each dollar earned by a business ends up as profit at the end of the year. In other words, it shows how much net income a business makes from each dollar of sales.
Definition: What is the Net Profit Margin Ratio?
Contents
Investors and analysts typically use net margin to gauge how efficiently a company is managed and forecast future profitability based on management’s sales forecasts. By comparing net income to total sales, investors can see what percentage of revenues goes to paying operating and non-operating expenses and what percentage is left over to pay shareholders or reinvest in the company.
A higher margin is always better than a lower margin because it means that the company is able to translate more of its sales into profits at the end of the period. Keep in mind that margins change drastically between industries and just become one industry has a lower average margin than another doesn’t mean that it is less profitable. Industries, like retailing, might have a lower average margin than other industries, but they make up for it in sheer volume of sales making them more profitable in total dollars.
Let’s take a look at how to calculate net profit margin ratio.
Formula
The net profit margin formula is calculated by dividing net income by total sales.

Net Profit Margin = Net Profit / Total Revenue
This is a pretty simple equation with no real hidden numbers to calculate. Both of these figures are listed on the face of the income statement: one on the top and one on the bottom.
Total revenue or total sales includes all the money a company earned from its operations during the period and is typically the first number listed on the income statement.
Net income represents the amount of revenue left over after all expenses have been paid for the period. This is always located at the bottom of the income statement hence the nickname “the bottom line.”
Let’s take a look at an example to see how this ratio is calculated.
Example
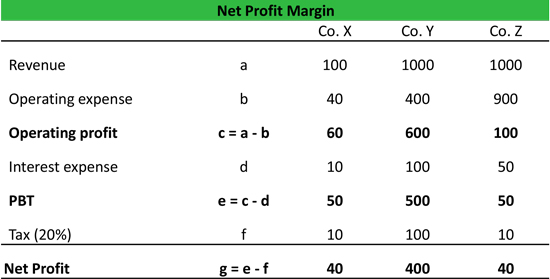
Company X, Y, and Z all operate in the same industry and report the following numbers on their income statements during this period.

We can compare Company X and Company Y on a net income basis, but that doesn’t tell us the entire story of their profitability. Based on their net income Company Y seem to be more profitable than Company X and Company Z. Similarly, both Company X and Company Z have the same net profit, so they might appear to be equally profitable.
However, we need to look at their total dollar amount of profits in the context of how much revenue these companies generated.
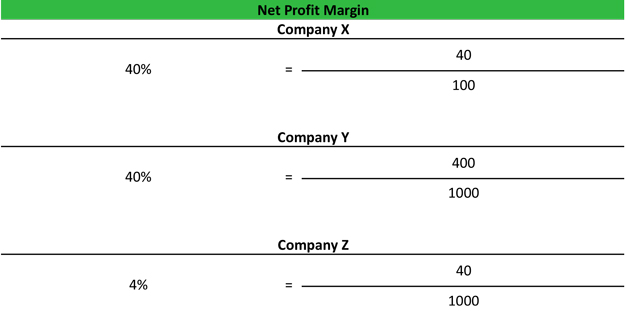
The net profit margin ratio equation will help us quantify the magnitude of profitability of the company. Each company’s NPM is calculated like this.

As we can see, both Company X and Company Y have the same NPM even though Company Y is 10 times bigger. Also, Company Z and Company X have the same net income, but their margins differ drastically.
Real world example
Now let’s look at some real world examples in the US retail industry. We are comparing the net profit margin of Wal-Mart and Costco. Both these names are major players in the industry and have good overlap in terms of product mix and offerings.
As you can see from the table below, Wal-Mart had a net income of ~$14.7bn in 2016, but that only represents only 3.1% of the revenue. Hence, it is always important to look at the net margin in the context of the industry average and historical trend. An IT company might have a net margin of more than 10%, but that is driven by the industry structure. So we should not compare companies in the different industry on the basis of NPM.


These examples highlight the importance of calculating net margin because it helps in comparing companies of different size and it measures performance efficiency of a company making it comparable to different companies of different sizes.
Analysis and Interpretation
How do analysts look at Net Margin?
As with most financial measurements, net margin is also most useful if compared to the company’s history and peers.
The historical analysis helps us understand if the company’s profitability is improving or declining. A trend analysis can help us question the sustainability of the business model. A declining margin might imply higher competition, reduced bargaining power, or inefficient cost base of a company. One needs to be cautious about time series analysis, especially in case the business model of a company has evolved or the product mix has changed with time. In the above example, we can see that the margin for Wal-Mart remained stable at ~3.4% in 2014 and 2015 but dipped slightly to ~3.1% in 2016. While in the case of Costco, the margin improved from 1.8% to 2.0% during the same period.
The cost base of different industries is different. Hence for meaningful comparison, it is necessary that the margin of only companies in the same industry with close product mix is used. In the above example, Wal-Mart is a much bigger company and has better margins compared to Costco.
The analysts also spend considerable amount of time in stripping down various elements of the net margin ratio to understand the drivers of margin. Another important practical usage of this ratio is to analyze its impact on ROE or other return measures (such as Du Pont analysis).
In conclusion, this ratio is one of the most important Income statement measures that management and investors analyze. However, we need to careful to adjust for one-off items. We should also consider historical and peer margin to draw a meaningful conclusion from the same.
Practical Usage Explanation: Cautions and Limitations
Net margin measures the overall profitability of a company. It considers all the operating and financing expenses by the company in its daily operations. In other words, it tells us how much of the revenue generated by the company is left for various corporate activities. For example, Company X has 40% of its revenue left to be utilized either to pay back the shareholders or to reinvest in the business.
While NPM is a useful measure to look at, it is some limitations.
First, it doesn’t give a clear picture of the operating profitability of the company. This is because it considers the interest payment and the tax shield from interest payment. The operating margin is better to measure in that regards.
Second, the company might have several one-off items that reduce the net income and negatively affect the margin of the company. In reality, however, these items are not expected to repeat in future. In such cases, analysts normally add back the one-off charges and recalculate Adjusted Net Profit (Adjusted Net Profit Margin).
In addition to the above problem, there is also the issue that NPM describes the accounting profit instead of cash profit of a company.
Nonetheless, this financial ratio is a useful tool when combined with other financial performance metrics.


