
Break-even point analysis is a measurement system that calculates the margin of safety by comparing the amount of revenues or units that must be sold to cover fixed and variable costs associated with making the sales. In other words, it’s a way to calculate when a project will be profitable by equating its total revenues with its total expenses. There are several different uses for the equation, but all of them deal with managerial accounting and cost management.
The main thing to understand in managerial accounting is the difference between revenues and profits. Not all revenues result in profits for the company. Many products cost more to make than the revenues they generate. Since the expenses are greater than the revenues, these products great a loss—not a profit.
The purpose of the break-even analysis formula is to calculate the amount of sales that equates revenues to expenses and the amount of excess revenues, also known as profits, after the fixed and variable costs are met. There are many different ways to use this concept. Let’s take a look at a few of them as well as an example of how to calculate break-even point.
Formula
The break-even point formula is calculated by dividing the total fixed costs of production by the price per unit less the variable costs to produce the product.
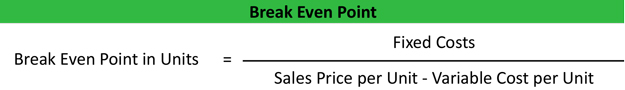
Since the price per unit minus the variable costs of product is the definition of the contribution margin per unit, you can simply rephrase the equation by dividing the fixed costs by the contribution margin.

This computes the total number of units that must be sold in order for the company to generate enough revenues to cover all of its expenses. Now we can take that concept and translate it into sales dollars.
The break-even formula in sales dollars is calculated by multiplying the price of each unit by the answer from our first equation.

This will give us the total dollar amount in sales that will we need to achieve in order to have zero loss and zero profit. Now we can take this concept a step further and compute the total number of units that need to be sold in order to achieve a certain level profitability with out break-even calculator.
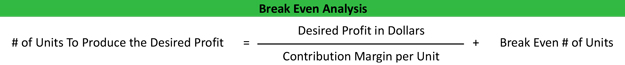
First we take the desired dollar amount of profit and divide it by the contribution margin per unit. The computes the number of units we need to sell in order to produce the profit without taking in consideration the fixed costs. Now we must add back in the break-even point number of units. Here’s what it looks like.
Example
Let’s take a look at an example of each of these formulas. Barbara is the managerial accountant in charge of a large furniture factory’s production lines and supply chains. She isn’t sure the current year’s couch models are going to turn a profit and what to measure the number of units they will have to produce and sell in order to cover their expenses and make at $500,000 in profit. Here are the production stats.
- Total fixed costs: $500,000
- Variable costs per unit: $300
- Sale price per unit: $500
- Desired profits: $200,000
First we need to calculate the break-even point per unit, so we will divide the $500,000 of fixed costs by the $200 contribution margin per unit ($500 – $300).

As you can see, the Barbara’s factory will have to sell at least 2,500 units in order to cover it’s fixed and variable costs. Anything it sells after the 2,500 mark will go straight to the CM since the fixed costs are already covered.
Next, Barbara can translate the number of units into total sales dollars by multiplying the 2,500 units by the total sales price for each unit of $500.

Now Barbara can go back to the board and say that the company must sell at least 2,500 units or the equivalent of $1,250,000 in sales before any profits are realized. She can also take it a step further and use a break-even point calculator to compute the total number of units that must be produced in order to meet her $200,000 profitability goal by dividing the $200,000 desired profit by the contribution margin then adding the total number of break-even point units.

These are just examples of the break-even point. You can use these as a template for your business or course work.
Analysis
As you can see there are many different ways to use this concept. Production managers and executives have to be keenly aware of their level of sales and how close they are to covering fixed and variable costs at all times. That’s why they constantly try to change elements in the formulas reduce the number of units need to produce and increase profitability.
For instance, if management decided to increase the sales price of the couches in our example by $50, it would have a drastic impact on the number of units required to sell before profitability. They can also change the variable costs for each unit by adding more automation to the production process. Lower variable costs equate to greater profits per unit and reduce the total number that must be produced. Outsourcing can also change the cost structure.
One of the most important concepts here is the margin of safety. That’s the difference between the number of units required to meet a profit goal and the required units that must be sold to cover the expenses. In our example, Barbara had to produce and sell 2,500 units to cover the factory expenditures and had to produce 3,500 units in order to meet her profit objectives. This 1,000-unit spread is the margin of safety. It’s the amount of sales the company can afford to lose but still cover its expenditures.
It’s also important to keep in mind that all of these models reflect non-cash expense like depreciation. A more advanced break-even analysis calculator would subtract out non-cash expenses from the fixed costs to compute the break-even point cash flow level.

