
What is the Sharpe Ratio?
Contents
Definition: The Sharpe ratio is an investment measurement that is used to calculate the average return beyond the risk free rate of volatility per unit. In other words, it’s a calculation that measures the actual return of an investment adjusted for the riskiness of the investment.
This measurement is particularly important when comparing two or more investment opportunities because it levels out the volatility in the market and flattens out the returns as if the risk was eliminated. Take a high-risk investment for example. This investment is much more volatile, increasing and decreasing in value much more, than a low-risk investment.
Assume that the high-risk investment had a higher return than the lower investment for a given year. Was this because the high-risk management or investment outperformed the low-risk investment or is this higher return simply based on the higher risk and volatility of the high-risk investment? You would never be able to know with out this ratio.
The Nobel laureate, William F. Sharpe, created the Sharp Ratio as a way to cancel out the risk component of investing in an effort to compare two different investment returns. Since his developed this formula, it has become the industry standard calculation. Let’s see how to calculate the Sharpe Ratio.
Sharpe Ratio Formula
The Sharpe Ratio formula is calculated by dividing the difference of the best available risk free rate of return and the average rate of return by the standard deviation of the portfolio’s return. I know this sounds complicated, so let’s take a look at it and break it down.
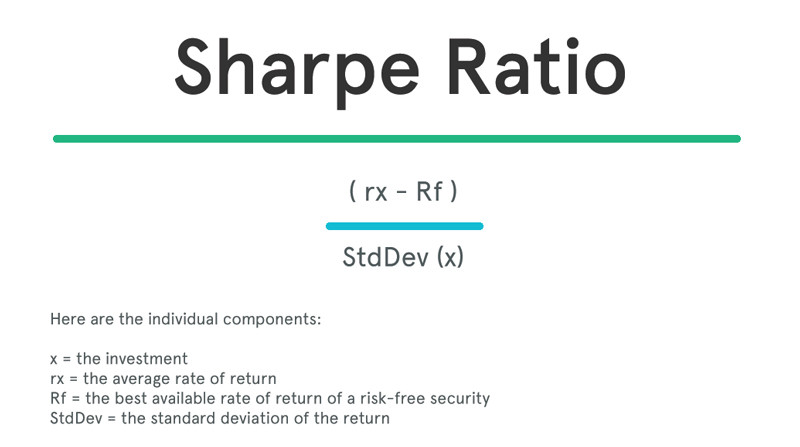
Formula: (Rx – Rf) / StdDev(x)
Here are the individual components:
- x = the investment
- rx = the average rate of return
- Rf = the best available rate of return of a risk-free security
- StdDev = the standard deviation of the return
Here is what the Sharpe ratio equation looks like in plain English.
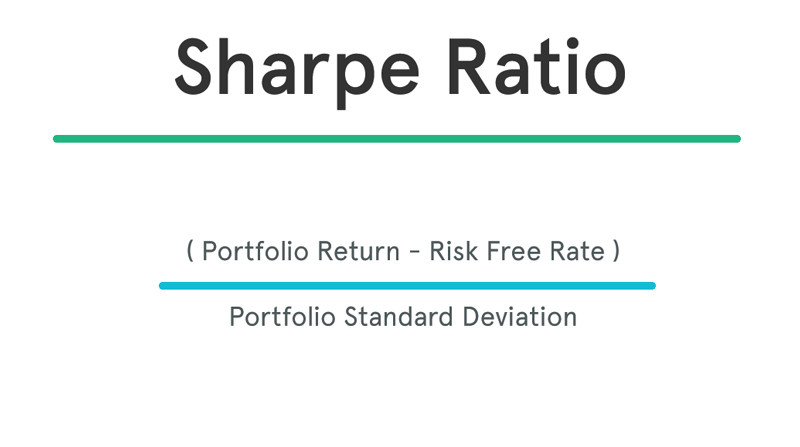
Although the math might be a little complicated if you aren’t familiar with finance equations, the concept is pretty simple. We are basically subtracting the risk free rate of return from the mean return to isolate the return based on the level of risk. We can then evaluate the investment performance based on the risk-free return.
Basically, the Sharpe ratio equation adjusts portfolios for risk and puts them all on a level risk playing field, so they can all be compared equally.
Analysis and Interpretation
A higher Sharpe metric is always better than a lower one because a higher ratio indicates that the portfolio is making better investment decisions and not being swayed by the risk associated with it. Here is a list of sharpe ratio grades and what they mean.
Sharpe Ratio Grading Thresholds
- <1: Not Good
- 1 – 1.99: Ok
- 2 – 2.99: Really Good
- >3: Exceptional
Take a portfolio that only invests in Treasure bills for example. These are considered risk-free investments, so there is no volatility and no earnings in excess of the risk-free rate. Thus, the Sharp Ratio would be zero for this portfolio.
Other portfolios with higher rates of risk might have a metric of 1, 2, or 3. Any metric equal to or greater than 3 is considered a great Sharpe measurement and a good investment all else equal.
A metric of 1, 2, or 3 tells us how much additional return we are getting for holding an risky investment over a risk-free investment. In a sense, it shows us the level of compensation we are receiving for the additional level of risk we are taking with the investment.
What is the Sharpe Ratio Used For?
Investors use this equation to see if they are comfortable with a particular investment. For example, they might feel that the return isn’t high enough for a certain level of volatility. In this case, it would be a bad investment and they should look elsewhere for something with a higher Sharpe ratio.
Some people complain about the Sharpe calculator and say that it is too easy to misinterpret making the data misleading. Two alternatives to the Sharpe method are the Treynor ratio and the Sortino ratio.
Example
Let’s assume that you want to compare two different mutual funds in your portfolio with different risk levels. Obviously, the more risky of the two will tend to have higher returns, but which one has a higher return relative to the risk associated with the investment? Let’s use the Sharpe ratio to see which one is performing better.
Investment #1
- Portfolio return: 20%
- Risk free rate: 10%
- Standard Deviation: 5
Investment #2
- Portfolio return: 30%
- Risk free rate: 10%
- Standard Deviation: 40
Sharpe Ratios
- Investment #1: 2
- Investment #2: .5
Sharpe Ratio Application
As you can see, investment #2 out performed investment #1 by a rate of 50 percent, but this doesn’t mean that investment #2 performed well relative to its risk level. The sharpe ratio tells us that the first investment actually performed better than the second relative to the risk involved in the investment. If the second investment performed as well as the first investment relative to risk, it would have earned a return of 90 percent.
The second investment may have earned a higher return this year, but it has a higher risk and likelihood of volatility in the future.

