
What is Contribution Margin?
Contents
Definition: The contribution margin, sometimes used as a ratio, is the difference between a company’s total sales revenue and variable costs. In other words, the contribution margin equals the amount that sales exceed variable costs. This is the sales amount that can be used to, or contributed to, pay off fixed costs.
The concept of this equation relies on the difference between fixed and variable costs. Fixed costs are production costs that remain the same as production efforts increase. Variable costs, on the other hand, increase with production levels.
The contribution margin measures how efficiently a company can produce products and maintain low levels of variable costs. It is considered a managerial ratio because companies rarely report margins to the public. Instead, management uses this calculation to help improve internal procedures in the production process.
Formula
The contribution margin formula is calculated by subtracting total variable costs from net sales revenue.
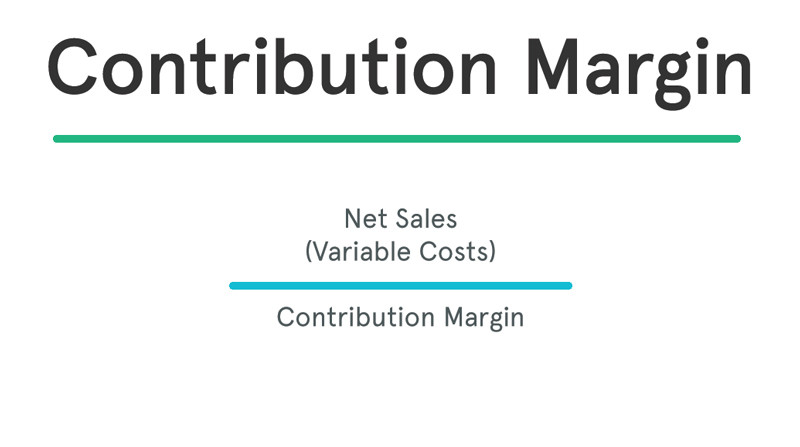
Contribution Margin = Net Sales – Variable Costs
Contribution Margin Formula Components
There are two main components in the contribution margin equation: net sales and variable costs. Let’s take a look at each.
What are net sales?
Net sales are basically total sales less any returns or allowances. This is the net amount that the company expects to receive from its total sales. This revenue number can easily be found on the income statement. Some income statements report net sales as the only sales figure, while others actually report total sales and make deductions for returns and allowances. Either way, this number will be reported at the top of the income statement.
What are variable costs?
Variable costs are expenses that increase proportionately as revenues or operations increase. A good example of this is raw materials. As a manufacturer produces more units, it will naturally need more materials. Thus, the cost of materials varies with the level of production. As production increases, material costs increase. As production decreases, material costs decrease. Other examples of variable costs include:
- Shipping costs
- Sales commissions
- Utilities
- Labor costs
- Production supplies
Variable costs are not typically reported on general purpose financial statements as a separate category. Thus, you will need to scan the income statement for variable costs and tally the list. Some companies do issue contribution margin income statements that split variable and fixed costs, but this isn’t common.
What is the difference between variable and fixed costs?
The difference between fixed and variable costs has to do with their correlation to the production levels of a company. As we said earlier, variable costs have a direct relationship with production levels. As production levels increase, so do variable costs and vise versa. This is the not the case with fixed costs. Fixed costs stay the same no matter what the level of production. Take rent for example. It doesn’t matter how many units are produced. Rent will always be the same.
Let’s look at an example.
Example
Casey owes and runs a manufacturing plant that makes grapple grommets. In the past year, Casey had sales of $1,000,000 and the following variable costs:
- Shipping costs: $100,000
- Utilities: $50,000
- Labor costs $400,000
- Production supplies: $300,000
Here’s how to calculate his company’s contribution margin.
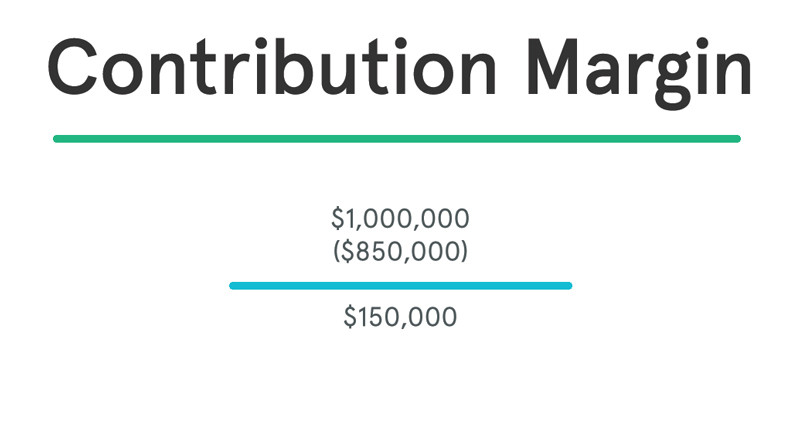
As you can see, Casey has a CM of $150,000. This means that he has $150,000 to put toward his fixed costs. The remainder of the margin after the fixed costs have been paid off is company profit. So let’s assume that Casey’s fixed costs include the following:
- Rent: $50,000
- Insurance: $35,000
- Property Taxes: $20,000
Casey’s total fixed costs equal $105,000. This means that the production of grapple grommets produce enough revenue to cover the fixed costs and still leave Casey with a profit of $45,000 at the end of the year.
Analysis and Interpretation
What is the Contribution Margin Used For?
Management uses the contribution margin in several different forms to production and pricing decisions within the business. This concept is especially helpful to management in calculating the breakeven point for a department or a product line. Management uses this metric to understand what price they are able to charge for a product without losing money as production increases and scale continues. It also helps management understand which products and operations are profitable and which lines or departments need to be discontinued or closed.
Management can also use this calculation for income management purposes. For example, if management has a specific profitability target that it needs to hit in the next year, it can use the CM formula to calculate a product pricing model that will help them increase profitability.
Investors and analysts use the contribution margin to evaluate how efficient the company is at making profits. For example, analysts can calculate the margin per unit sold and use forecast estimates for the upcoming year to calculate the forecasted profit of the company.
High vs. Low Contribution Margin
A high margin is almost always a better sign than a low margin because this means one of two things: either the company’s variable costs are very low or the company is able to sell its product for much more than its variable costs. Both scenarios are favorable because it shows that the company is able to generate enough revenue to pay its variable costs and will have funds to cover its fixed costs.
A low margin typically means that the company, product line, or department isn’t that profitable. This could be caused by a number of different circumstances. For instance, the price of steel might have increased. An increase like this will have rippling effects as production increases. Management must be careful and analyze why CM is low before making any decisions about closing an unprofitable department or discontinuing a product, as things could change in the near future.
Management should also use different variations of the CM formula to analyze departments and product lines on a trending basis like the following.
Contribution Margin Per Unit
It’s also common for management to calculate the contribution margin on a per unit basis. This formula shows how much each unit sold contributes to fixed costs after variable costs have been paid.

This metric is typically used to calculate the break even point of a production process and set the pricing of a product. They also use this to forecast the profits of the budgeted production numbers after the prices have been set.
Contribution Margin Ratio
The contribution margin ratio takes the concept of the contribution margin per unit produced and calculates it as a percentage of the sales price per unit. This shows what percentage of sales is made up of the contribution margin.

Managerial accountants also use the contribution margin ratio to calculate break-even points in the break-even analysis.
Income Statement
The contribution margin income statement separates the fixed and variables costs on the face of the income statement. This highlights the margin and helps illustrate where a company’s expenses. Variable expenses can be compared year over year to establish a trend and show how profits are affected.

